I build a sorting visualization tool: Check it out
What Technologies I used
- Github Pages (Hosting & Deployment)
- D3.js (Visualization)
- Javascript (UI & Sorting Logic)
- HTML (UI)
- CSS (Styling)
How did I build It
Code
All of the code available on Github.
Data Object
The SortData type serves as a wrapper that contains all the necessary information for visualizing the sorting algorithm.
type SortData = {
    init_index: number,
    value: number,
    color: string
}
Data Validation and Object Creation
Helper functions
- The
validateDatafunction validates the user input data to ensure that it is in the correct format and can be processed. The function checks if the input string contains only numbers and commas, and returns an error message if it does not. - The
convertDatafunction takes the validated input string and converts it into an array of numbers. It splits the string by commas and converts each substring into a number. It returns an error message if the conversion fails. - The
arrayToSortDatafunction takes a number array and converts it into an array ofSortDataobjects, which are used for visualization. The function assigns ainit_indexto each data point and sets its value, and color.
function validateData(userInput) {
    if (userInput.length === 0) {
        return false
    }
    else if(!(/ ?([0-9]* ?,)/.test(userInput))){
        return false
    } else {
        const data = convertData(userInput)
        for (let val of data) {
            if (val === undefined) {
                return false
            }
            return true
        }
    }
}

function convertData(userInput) {
    return  userInput.split(',').map(element => {
        return Number(element) ? Number(element) !== undefined : 0;
    })
}

function arrayToSortData (nums: number[], color: string) {
    let data: SortData[] = []
    nums.map( (num, index) => {
        data.push({init_index: index, value: num, color: color} as SortData);
    })
    return data;
}
Visualization
D3 is a javascript visualization library build on top of Web Components. The library provides a lot of helpful components for generating different graphics. I would highly recommend you check them out for some next level interactive visualizations.
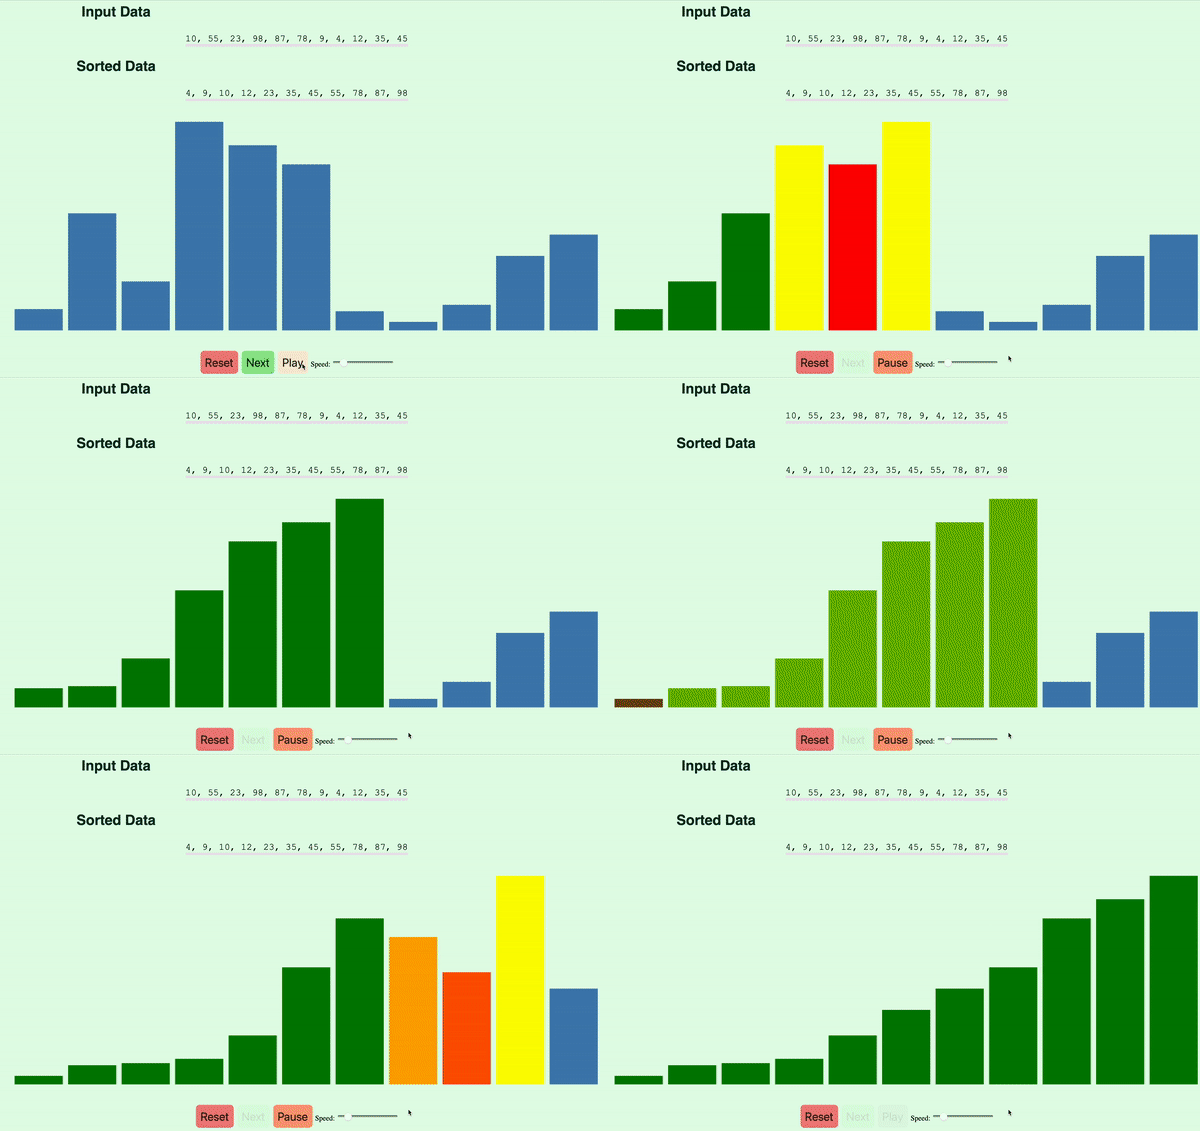
For the visualization, I used the rect shape to render a histogram which represents the different values provided by the users and colors are used to indicate the state of the different values. The colors of the histogram is used to communicate the transition of each step.
Color Map
- Blue: Base/Unsorted
- Green: Sorted
- RED: Selected
- Yellow: Pointer location
- Tile: Pivot
const svg = d3.select("#"+ id)
    .append("svg")
    .attr("width", width)
    .attr("height", height)
    .attr("viewBox", [0, 0, width, height])
    .attr("style", "max-width: 100%; height: auto; height: intrinsic;");


var bar = svg.append("g")
.selectAll("rect"+id)
.data(I)
.join("rect")
    .attr("x", i => xScale(X[i]))
    .attr("y", i => yScale(Y[i]))
    .attr("height", i => yScale(0) - yScale(Y[i]))
    .attr("width", xScale.bandwidth())
    .attr("fill", i => data[i].color);
Animation
Set setInterval is used to call the sortStep with a certain amount of delay which is specified by the user.
function playSort(dataObject) {
    if (dataObject.sorted) {
        return
    }
    dataObject.timer = setInterval(function() {
        dataObject.sortStep(dataObject);
        updateRender(dataObject);
        if (dataObject.sorted) {
            clearInterval(dataObject.timer);
            dataObject.sortedUpdateUI();
        }
    }, dataObject.freeRunTime)
}

function toggleInsertPlay(dataObject) {
    if (!dataObject.paused) {
        dataObject.paused = true;
        clearInterval(dataObject.timer);
        document.getElementById("nextButton").className = "button";
        document.getElementById("playPauseButton").innerHTML = "Play"
        document.getElementById("playPauseButton").className = "playButton"
    } else {
        playSort(dataObject)
        paused = false
        document.getElementById("nextButton").className = "disabled";
        document.getElementById("playPauseButton").innerHTML = "Pause"
        document.getElementById("playPauseButton").className = "pauseButton"
    }
}
Final Animation

Final Thoughts
While I enjoyed building the sorting visualization, I realize in retrospect that I should have separated the sorting logic and visual elements for better reusability and expandability. My recommendation to fellow programmers would be to consider implementing an MVC design for visualizations. Additionally, I found D3.js to be a powerful tool for data visualization and look forward to using it again in the future. I hope you found the comparison of different sorting algorithms in the visualization to be informative and enjoyable.
